I find emergent behavior fascinating, how a set of simple rules can generate complex patterns. Let's use elementary cellular automata to explore emergent behavior in this post.
An elementary cellular automaton is a line of cells where each cell has a binary state (off or on). The next generation of a cell depends on the current state of three cells: the cell itself and its left and right neighbors. This means that there are 2^3 = 8 possible state configurations that determine the state of a cell in the next generation.
Recently, I wrote a small program that generates space-time diagrams for elementary cellular automata. Often, for example on Wikipedia1, space-time diagrams for cellular automata are black/white; off=white and on=black. While I was in "exploration-mode", I realized2 that we could try to visualize the 8 different state configurations instead of the actual cell states. So I updated my program to do this: add color to cells with state "on", the color corresponds to the 3-cell configuration from the previous generation that determined the cell's current state. The results are interesting, patterns appear in the colored diagrams that cannot be seen in the black/white ones.
For example, see the diagrams for rule 3 below. The colored diagram adds color to the border between the line patterns, but otherwise the patterns are very similar.
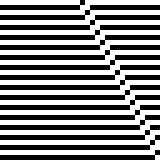
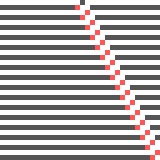
Another interesting example is rule 18 below. The colored diagram adds a new pattern to the figure: SW-oriented lines are red, NW-oriented lines are blue.
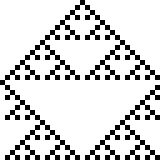
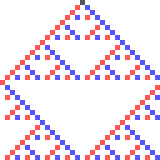
Something similar happens with rule 57, diagonal lines follow a color pattern while horizontal are black/white:
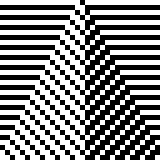
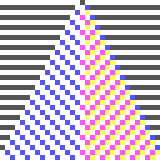
I find it fascinating that when I introduced a new simple rule - "color code the state configuration that determined the cell state" - then a new emergent pattern appeared in the output diagrams.
Unfortunately, I won't have time to go deeper into this rabbit hole at the moment. You can find the source code to the program that generated these diagrams on GitHub3.
-
https://en.wikipedia.org/wiki/Elementary_cellular_automaton#Images_for_rules_0-99 ↩︎
-
This idea is not new, I am certainly not the first one add colors to cellular automata. See for example http://www.eddaardvark.co.uk/v2/automata/index.html ↩︎